Wajdi Belgacem

Data Insights Real impact

Wajdi Belgacem, Applied Economist

With a strong background in data analysis, economic modeling, and policy evaluation, I provide actionable insights for businesses and policymakers.

Areas of expertise

  • Insurance & Risk Modeling
  • Climate Risk & Business Resilience
  • Markets & Industry Trends
  • Policy & Program Evaluation

Interactive dashboard · Public data

Agricultural Insurance
Explorer

Explore ten years of USDA insurance data across crops, forage, livestock, and dairy. Compare state-level insured liability, premiums, indemnities, and loss ratios, with program filters, historical trends, and downloadable data.

United States 2016–2025

Open dashboard Source code (ZIP, 16 KB)
USDA insurance dashboard showing a U.S. state map, insured liability, premiums, indemnities, and loss ratios. USDA insurance dashboard showing a U.S. state map, insured liability, premiums, indemnities, and loss ratios.
Compare insurance results across states and programs using published USDA data.

Interactive dashboard · Commodity risk

Commodity Price
& Cost Risk

Explore corn and soybean meal prices using public USDA data. Compare historical volatility and test how price changes affect a purchasing budget, with adjustable quantities, delivery costs, and downloadable scenarios.

Monthly market benchmarks 2000–2026

Open dashboard Source code and data (ZIP, 0.6 MB)
Corn and soybean meal benchmark prices, historical volatility, and an interactive price comparison chart. Corn and soybean meal benchmark prices, historical volatility, and an interactive price comparison chart.
Public market data and adjustable purchasing-cost scenarios.

Insurance evaluation · Geospatial analysis

Insurance Performance
& Risk Assessment

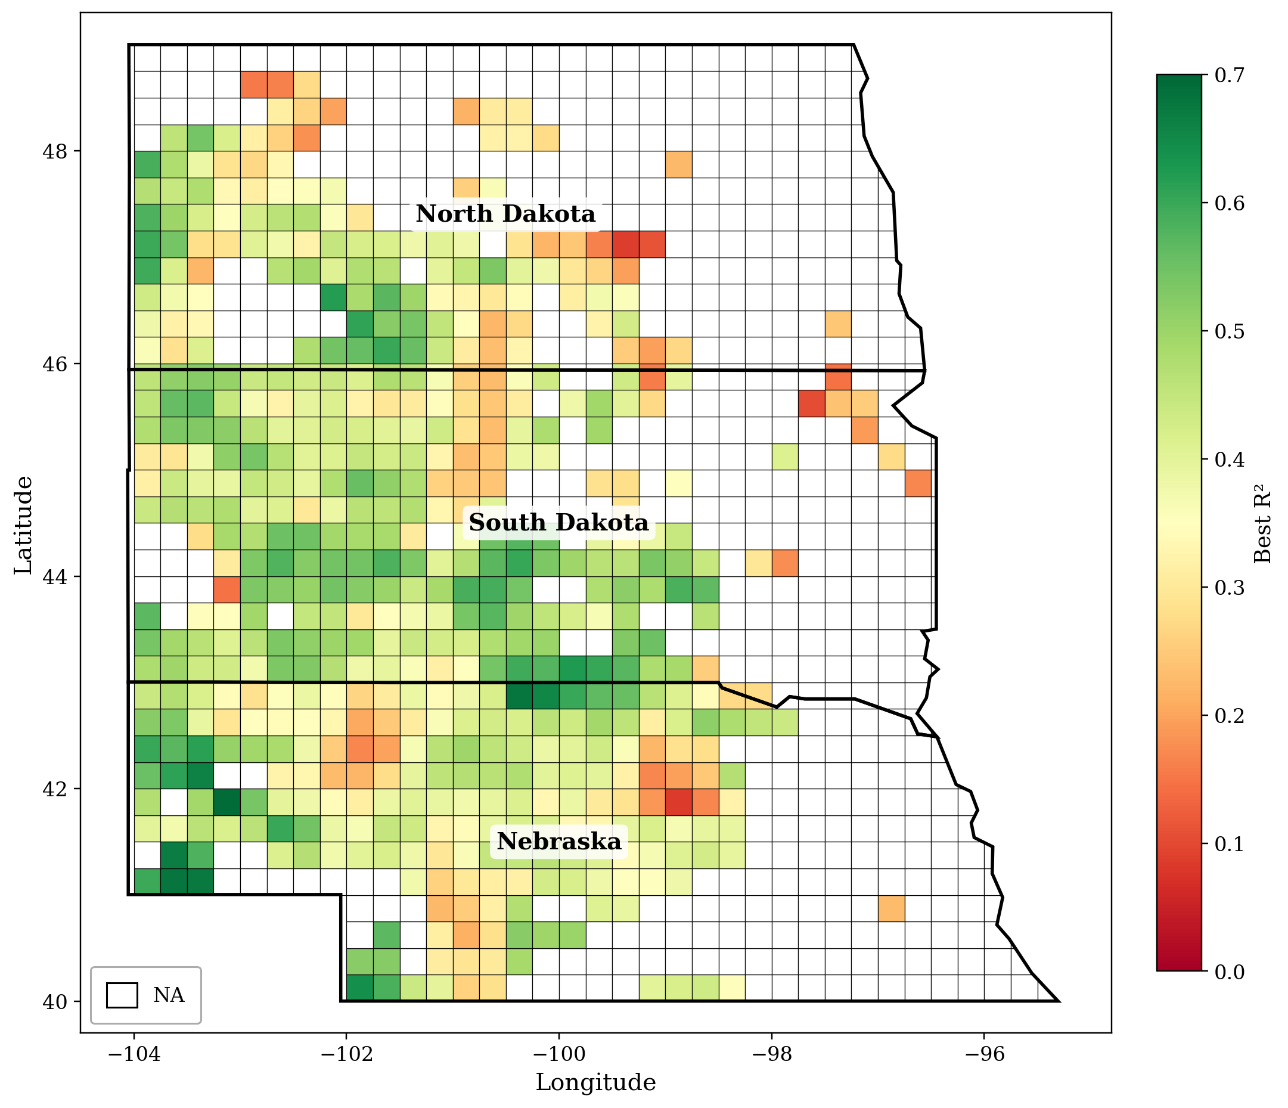
I combined satellite-derived forage estimates with rainfall-index records to evaluate insurance performance across 548 geographic grids in the Northern Great Plains. The analysis quantifies gaps between rainfall-based payment triggers and forage shortfalls to assess coverage intervals and program design.

Nebraska, North Dakota & South Dakota 1990–2024

View project
Map of historical rainfall–forage model fit across Nebraska, North Dakota, and South Dakota. Higher R-squared values indicate a closer fit.
How closely rainfall tracks forage production. Historical model fit across the study region.

Climate risk · Panel econometrics

Climate Risk &
Conservation Adoption

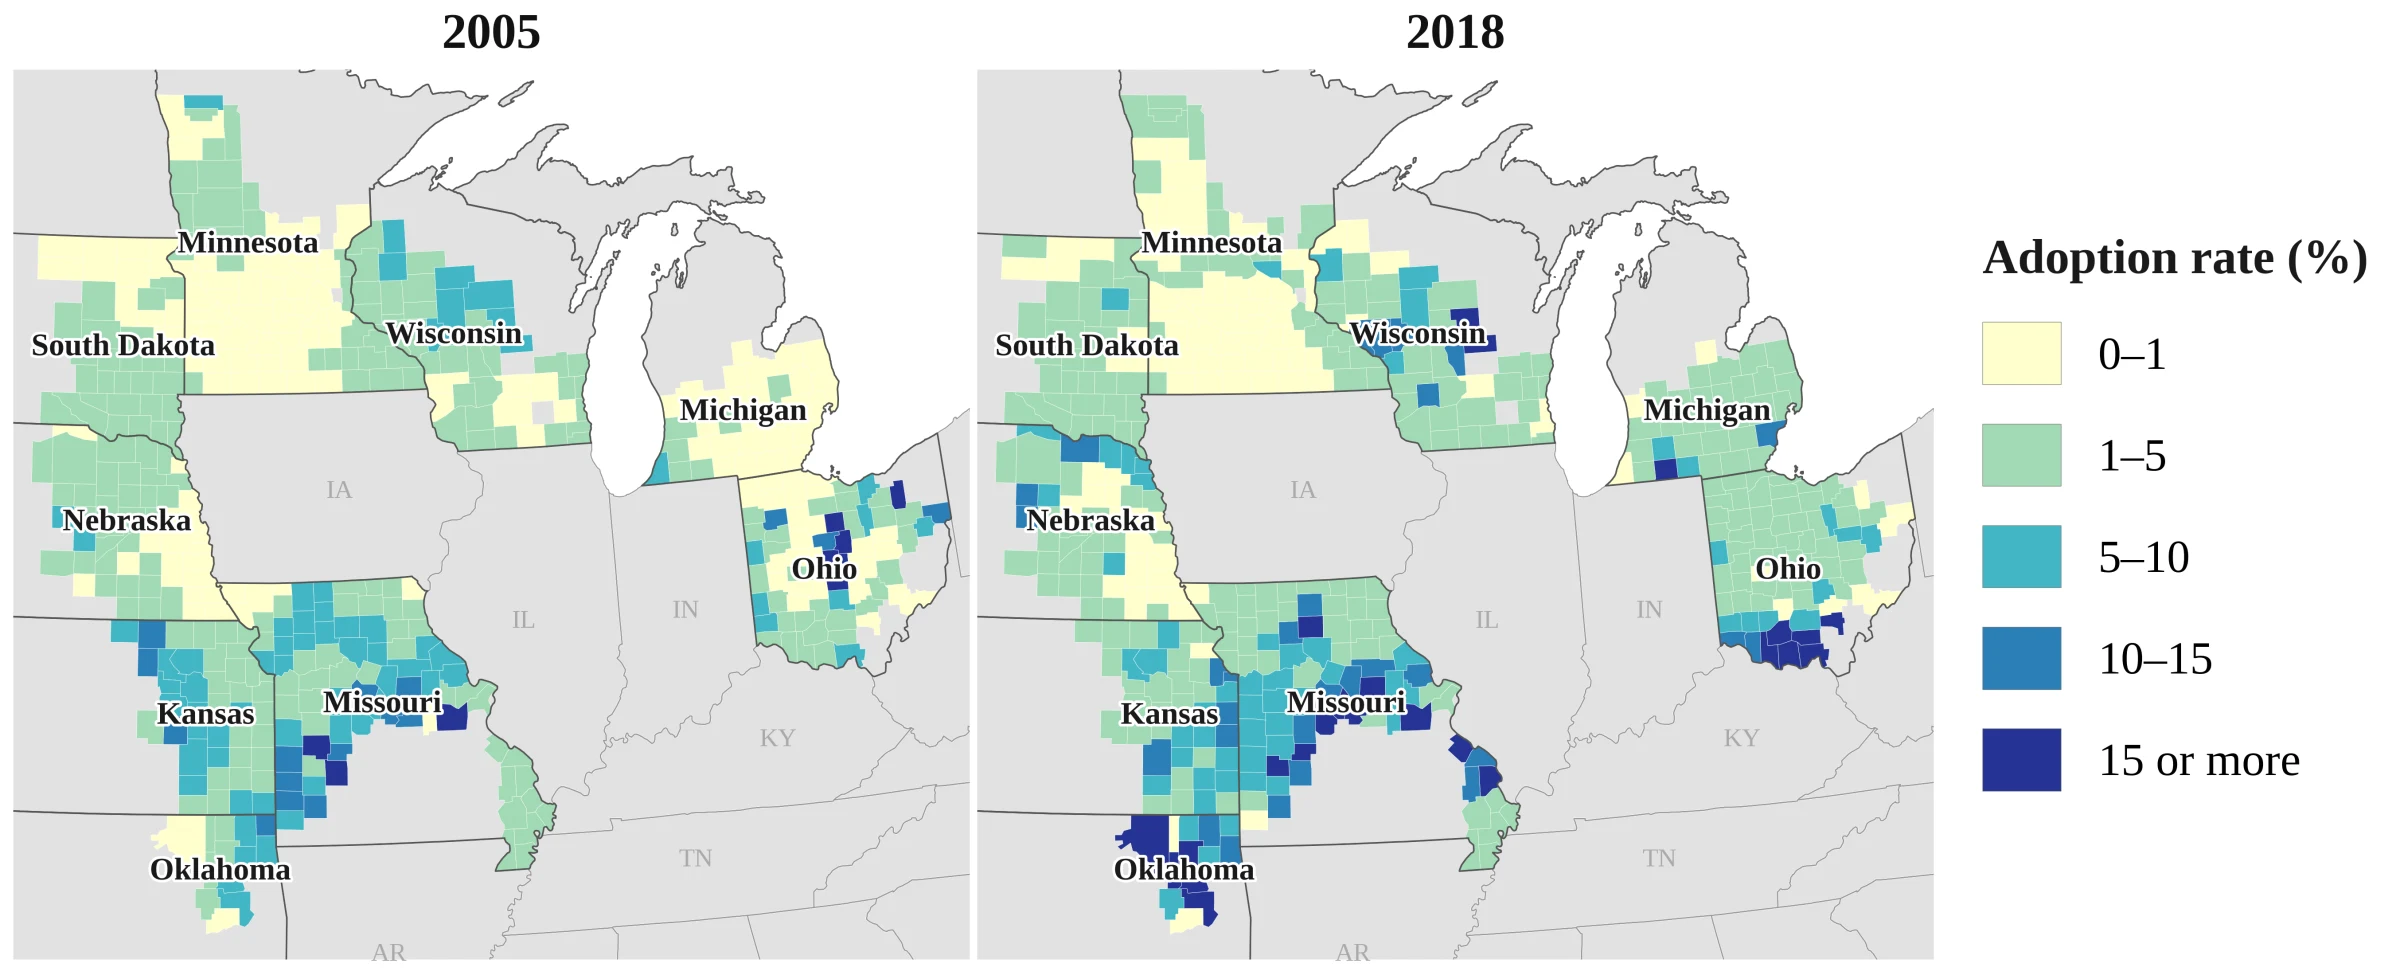
I used satellite data and panel econometrics to examine how drought and wetness relate to cover-crop adoption across 440 counties in nine states.

Midwest & Great Plains 2005–2018

View project
Figure S1: county maps comparing the percentage of cropland with established cover crops in 2005 and 2018 across nine U.S. states.
Cover-crop adoption in 2005 and 2018. Percentage of classified cropland with established cover crops.

Environmental assessment · Scenario analysis

Food Systems &
Environmental Footprints

This study compares European, Western, and Mediterranean dietary scenarios using food-consumption data and published life-cycle estimates of land use, water use, greenhouse-gas emissions, and eutrophication.

Published in Nutrients 2021

View project
Table 1: color-coded global-average environmental footprints of food products, comparing land use, water use, greenhouse-gas emissions, and eutrophication per kilogram of food.
Environmental footprints of food products. Colors compare lower and higher values within each indicator.

Selected publications

View all publications

Get in touch