Risk analysis · Insurance evaluation
Insurance Performance & Risk Assessment
Evaluating whether rainfall-index insurance responds to forage shortfalls in the Northern Great Plains.
- Program
- Pasture, Rangeland & ForageRainfall-index insurance
- Region
- Northern Great PlainsNebraska · North Dakota · South Dakota
- Study period
- 1990–202435 years of historical data
- Analytical sample
- 548 geographic grids19,180 grid-year observations
The problem
Rainfall-index insurance triggers payments using rainfall measurements. A producer’s forage production can fall even when the rainfall index does not trigger a payment. This mismatch is one form of basis risk.
The study evaluates how closely the rainfall index tracks forage production, how often payment triggers miss forage shortfalls, and how calculated indemnities compare with estimated losses.
My contribution
I carried out data preparation, method development, estimation, mapping and figure production, and manuscript drafting.
Coauthored with T. Wang and J. Parsons.
Findings
How closely rainfall tracks forage production.
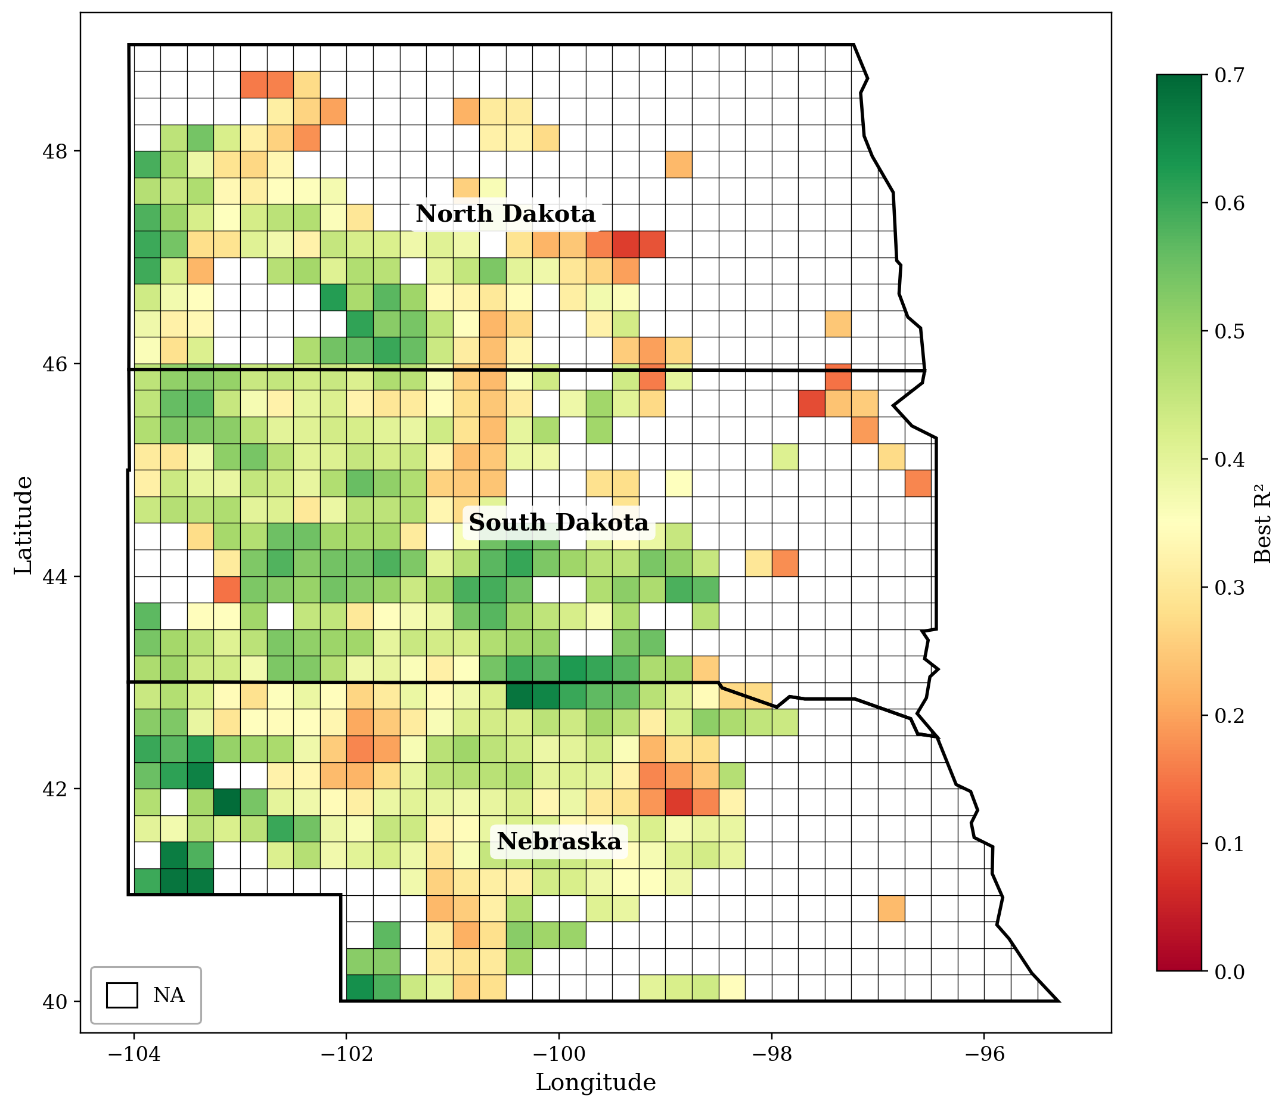
of annual forage variation explained, on average
Even each grid’s best-fitting rainfall-interval pair leaves substantial forage variation unexplained. The strength of the relationship varies across the region.
Historical fit within the study sample; not out-of-sample forecasting accuracy.
average probability of no payment trigger during a qualifying forage shortfall
At 90% coverage, neither selected interval triggered a payment at this estimated average rate when the forage index fell below 90% of its historical baseline. Each grid uses its own best-fitting interval pair.
Table 2; average across 548 grids. State averages: Nebraska 10.0%, South Dakota 7.5%, North Dakota 6.0%.
Analytical approach
Build the analytical dataset
Combine Rangeland Analysis Platform forage estimates, USDA RMA rainfall-index records, and land-cover information. Construct a growing-season forage index relative to each grid’s historical production baseline.
Evaluate rainfall intervals
Estimate 45 admissible pairs of non-overlapping rainfall intervals for each grid. Identify the pair with the highest historical fit to forage production, measured by R².
Assess insurance performance
Estimate the frequency of missed payment triggers during forage shortfalls. Compare calculated indemnities with estimated forage-loss values under the study’s contract assumptions.
Practical relevance
The analysis provides evidence for evaluating how well a rainfall-based product addresses forage-production risk. It identifies geographic differences in index performance and offers a basis for testing alternative interval choices, weights, and program designs.
These results can support program evaluation and the development of location-specific guidance.
Interpreting the results
The results are historical, grid-level estimates using satellite-derived forage production, rather than individual farm yield or claims records. The analysis assumes two equally weighted intervals and a productivity factor of 1.
The best-fitting intervals are selected using the historical sample; their fit is not a measure of out-of-sample forecasting accuracy. A triggered payment does not necessarily compensate the full estimated loss.